I have been using social network analysis (SNA) both for understanding shifts in the scope and depth of collaborations within networks, and to understand if and how relationships among a cohort of fellows in a leadership development programme shift over time. This blog talks to use in evaluating advocacy networks.
APC TIG Week: Using SNA to quantify and visualise relationships of power and influence in advocacy networks by Barbara Klugman
 Hi, I’m Barbara Klugman. I offer strategy support and conduct evaluations with social justice funders, NGOs, networks and leadership training institutions in South Africa and internationally. I practice utilization-focused evaluation, frequently using mixed methods including outcomes harvesting and Social Network Analysis (SNA).
Rad Resource: For advocacy evaluation, SNA can help identify:
Hi, I’m Barbara Klugman. I offer strategy support and conduct evaluations with social justice funders, NGOs, networks and leadership training institutions in South Africa and internationally. I practice utilization-focused evaluation, frequently using mixed methods including outcomes harvesting and Social Network Analysis (SNA).
Rad Resource: For advocacy evaluation, SNA can help identify:
- how connected different types of advocacy organizations are to each other;
- what roles they play in relation to each other such as information exchange, partnering for litigation, driving a campaign, or linking separate networks;
- if and how their positioning changes over time in terms of relative influence in the network.
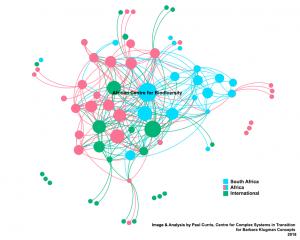
The method involves surveying all the groups relevant to the evaluation question, asking if they have a particular kind of relationship with all other groups surveyed. To illustrate the usefulness of SNA, the map below illustrates an information network of the African Centre for Biodiversity, a South African NGO. In the map, each circle is an organization, sized by the number of organizations who indicated “we go to this organization for information” – to answer one piece of the evaluation question, regarding the position and role of the evaluand in its field, nationally and regionally. Of the 55 groups advocating for food sovereignty in the region who responded, the evaluand is the main bridger between South African groups and others on the continent. It is also a primary information provider to the whole group alongside a few international NGOs and a few African regional organizations.
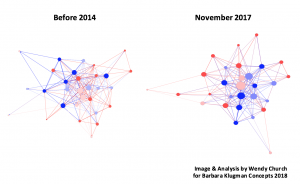
 As another example, an SNA evaluating the Ford Foundation’s $54m Strengthening Human Rights Worldwide global initiative distinguished changes in importance and connectedness before the initiative and after four years, among those inside the initiative (blue), ‘matched’ groups with similar characteristics (orange), and five others in Ford’s portfolio (pink). It shows that the initiative’s grantees and notably those from the Global South (dark blue) have developed more advocacy relationships than have the matching groups (see larger size of nodes and more connections). However, the largest connector for advocacy remains Amnesty International – the big pink dot in the middle, demonstrating its continuing differential access to resources and influence relative to the other human rights groups.
Hot tips:
- Keep it simple: As surveys ask about each organization, responding takes time, so ask only about roles that closely answer the evaluation questions regarding the network. For example, “my organization has engaged with them in advocacy at a regional forum”; “my organization has taken cases with them”
- Work with a mentor: While SNA software like Gephi is open access, making sense of social network data requires statistical analysis capacity and SNA theory to extract meaning accurately.
Lesson Learned:
- Consider whether or not to show names of groups as your tables or maps will surface who is ‘in’ and who is on the outside of a network in ways that might have negative consequences for group dynamics or for individual groups, or expose group’s negative perceptions of each other.
Rad resources:
Wendy Church, Introduction to Social Network Analysis, 2018.
Hi, I’m Barbara Klugman. I offer strategy support and conduct evaluations with social justice funders, NGOs, networks and leadership training institutions in South Africa and internationally. I practice utilization-focused evaluation, frequently using mixed methods including outcomes harvesting and Social Network Analysis (SNA).
Rad Resource: For advocacy evaluation, SNA can help identify:
- how connected different types of advocacy organizations are to each other;
- what roles they play in relation to each other such as information exchange, partnering for litigation, driving a campaign, or linking separate networks;
- if and how their positioning changes over time in terms of relative influence in the network.
The method involves surveying all the groups relevant to the evaluation question, asking if they have a particular kind of relationship with all other groups surveyed. To illustrate the usefulness of SNA, the map below illustrates an information network of the African Centre for Biodiversity, a South African NGO. In the map, each circle is an organization, sized by the number of organizations who indicated “we go to this organization for information” – to answer one piece of the evaluation question, regarding the position and role of the evaluand in its field, nationally and regionally. Of the 55 groups advocating for food sovereignty in the region who responded, the evaluand is the main bridger between South African groups and others on the continent. It is also a primary information provider to the whole group alongside a few international NGOs and a few African regional organizations.
As another example, an SNA evaluating the Ford Foundation’s $54m Strengthening Human Rights Worldwide global initiative distinguished changes in importance and connectedness before the initiative and after four years, among those inside the initiative (blue), ‘matched’ groups with similar characteristics (orange), and five others in Ford’s portfolio (pink). It shows that the initiative’s grantees and notably those from the Global South (dark blue) have developed more advocacy relationships than have the matching groups (see larger size of nodes and more connections). However, the largest connector for advocacy remains Amnesty International – the big pink dot in the middle, demonstrating its continuing differential access to resources and influence relative to the other human rights groups.
Hot tips:
- Keep it simple: As surveys ask about each organization, responding takes time, so ask only about roles that closely answer the evaluation questions regarding the network. For example, “my organization has engaged with them in advocacy at a regional forum”; “my organization has taken cases with them”
- Work with a mentor: While SNA software like Gephi is open access, making sense of social network data requires statistical analysis capacity and SNA theory to extract meaning accurately.
Lesson Learned:
- Consider whether or not to show names of groups as your tables or maps will surface who is ‘in’ and who is on the outside of a network in ways that might have negative consequences for group dynamics or for individual groups, or expose group’s negative perceptions of each other.
Rad resources:
Wendy Church, Introduction to Social Network Analysis, 2018.
No comments:
Post a Comment